.png)

The Simple Guide.to Real Estate
Curated by Justin Baarts
The February data is in, and the Central Okanagan single-family home market is showing some interesting shifts. If you are planning to buy or sell this spring, these numbers tell a specific story about where the leverage lies.
Here is the breakdown of what happened in February 2026 compared to the same time last year.
The Big Picture: Single-Family Homes
The single-family market in the Central Okanagan saw a mix of cooling prices and shifting inventory levels.
Benchmark Price: The price for a typical home is now $1,056,600. This is a 5.7% drop from February 2025.
Total Sales: There were 115 homes sold in February. Sales activity slowed down by 5.7% year-over-year.
Inventory: There are 1,045 active listings on the market. Total inventory has decreased by 9.6% compared to last year.
Days to Sell: On average, it takes 81 days to sell a home. This is a 9.9% increase in time on market.
Neighbourhood Spotlight
Not every area followed the same trend. Some neighbourhoods saw prices rise even as the overall market dipped.
| Neighborhood | Benchmark Price | Price Change (YoY) | Sales |
| Upper Mission | $1,303,100 | -1.4% | 6 |
| Wilden | $1,313,700 | -2.1% | 1 |
| Lower Mission | $1,201,700 | -0.6% | 2 |
| Black Mountain | $1,153,400 | +1.3% | 8 |
| Rutland North | $829,900 | +2.9% | 7 |
Strategist’s Take: What This Means for You
For Sellers: Inventory is down by nearly 10%. This means you have less competition than sellers did last year. However, homes are sitting on the market longer. Buyers are being pickier because prices are still over the million-dollar mark on average. To win in this market, your home needs to be show-ready and priced sharply from day one.
For Buyers: The 5.7% drop in benchmark prices is a silver lining. You have more room to negotiate than you did a year ago. With homes taking an average of 81 days to sell, you don't always have to rush into a decision. You can take the time to do proper inspections and due diligence.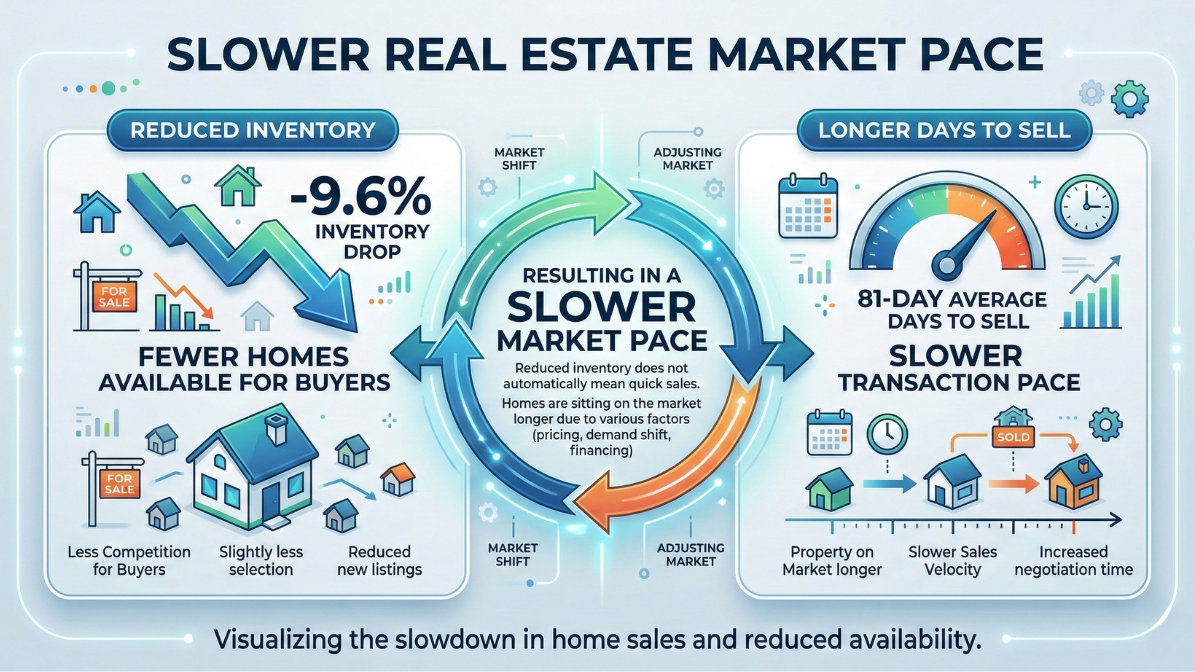
Planning Your Next Move?
The Central Okanagan market is moving into a more balanced state. It is no longer a frantic "seller's market," but the low inventory keeps it from being a total "buyer's market." Success right now depends on hyper-local data.
Want to know how these stats directly impact you?